

Swap SUI

SUI Price Today — Live USD Chart, Market Data and Converter

See the current value of SUI in US dollars, follow its price history and compare market figures before deciding what to do with your coins. Check the update time alongside the live price; if data is unavailable or delayed, do not use an old figure as a current exchange quote.

SUI/USD $0.886191
-4.65% · 24h
24h low $0.83523324h high $0.959661

Last updated: Oct 30, 2026 13:02 GMT+0000 · data: CoinGecko

SUI Price in USD Right Now

The live USD price is a market reference for one SUI, not the guaranteed amount of another asset an exchange order will deliver. Check the last-update time, the 24-hour percentage change and the high and low for the same reporting window. A rising daily percentage only says the latest reference price is above its value at the beginning of that window; it does not describe every move in between.

Live market fieldHow to read it
SUI/USDReference value of one native SUI in US dollars at the displayed update time
24h changePercentage move over the provider's rolling 24-hour window
24h low / highLowest and highest observed values in that same window
Last updatedTime the displayed market record was refreshed, separate from your browser's clock

Compare these values with their displayed timestamps. A source that updates its price more often than its 24-hour statistics can briefly show figures from different moments.

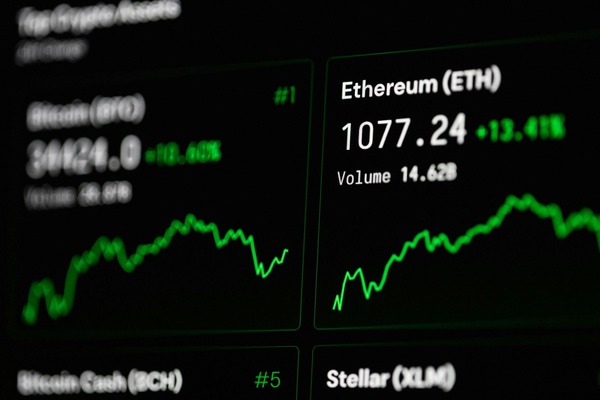
Crypto price tickers with green charts on a dark screen

SUI Price Chart and Historical Range

Choose 24 hours to inspect a recent move, seven or 30 days for a broader trend, and 90 days or one year for longer context. A short candle or line-chart movement does not, by itself, explain its cause. Check the selected period and currency before comparing screenshots from different services.

SUI/USDT
  • Start0.930865 USDT
  • Latest0.885354 USDT
  • High0.957894 USDT
  • Low0.842224 USDT
  • Change, 24H-4.89%
SUI/USDT price, 24HSUI price decreased from 0.930865 USDT on Oct 29, 2026 13:05 to 0.885354 USDT on Oct 30, 2026 13:03.0.95790.9290.90010.87110.842213:0519:0401:0407:0313:03

SUI price decreased from 0.930865 USDT on Oct 29, 2026 13:05 to 0.885354 USDT on Oct 30, 2026 13:03.

Chart data for this period is temporarily unavailable. Please check back later.

Chart data for this period is temporarily unavailable. Please check back later.

Chart data for this period is temporarily unavailable. Please check back later.

Chart data for this period is temporarily unavailable. Please check back later.

The chart above tracks the SUI/USDT market pair. USDT targets the value of a US dollar, but its market quote is not literally a SUI/USD feed. Read the headline USD figure and USD calculator separately from this USDT-pair chart; their quote currencies differ.

Reading an all-time high and low

An all-time high (ATH) and all-time low (ATL) depend on the provider's available trading history and quote currency. Their dates and values should be displayed together. A coin can be far below a recorded high while still gaining over the past day; those statements use different starting points. Historical extremes do not establish where the next trade will occur.

  • All-time high · Jan 4, 2025$5.35Current price vs this level: -83.43%
  • All-time low · Oct 19, 2023$0.364846Current price vs this level: 142.89%
Comparing 24 hours with longer periods

Use equal windows when comparing two returns. A 24-hour change, a seven-day chart and a monthly candle cannot be substituted for one another. If a chart displays an unusual single spike, check volume and another market source before treating it as a general market price. A low-liquidity venue or one data error can distort a short interval.

Convert SUI to USD for a Reference Amount

Enter the amount of SUI to multiply by the current USD reference price. The result is an estimate of market value at that moment, before any exchange spread, service fee or payout-network cost. For example, if the displayed price were $1.20, 25 SUI would have a reference value of $30.00. That number is an arithmetic example, not a current quotation.

1 SUI ≈ 0.88498 USD
Reference value, USD 0.88498
  • 1 SUI0.88498 USD
  • 10 SUI8.8498 USD
  • 50 SUI44.249 USD
  • 100 SUI88.498 USD
  • 500 SUI442.49 USD

Reference rate updated Oct 30, 2026 13:04 · data: CoinGecko

For a reverse estimate, divide the target USD value by the live SUI/USD figure. If the hypothetical price were $1.20, $60 would correspond to about 50 SUI before costs. Refresh the data before using a calculated amount: even a small price move changes the result. To execute a trade rather than estimate value, compare the live payout in SUI to USDT or USDT to SUI with the source and destination networks selected.

Gold crypto coins on dollar bills over a market chart

Market Cap, Volume, FDV and Supply

Market capitalization multiplies the current price by circulating SUI. Fully diluted valuation (FDV) uses the maximum supply instead; it is a hypothetical valuation at the same unit price, not cash invested in the network. Twenty-four-hour volume estimates how much was traded over that window. High volume can accompany both rising and falling prices, so volume alone does not indicate direction.

  • Market cap$3.65B
  • Fully diluted valuation$8.86B
  • 24h volume$654.26M
  • Circulating supply4.12B SUI
  • Maximum supply10.00B SUI
  • Last updatedOct 30, 2026 13:02

SUI has a stated maximum supply of 10 billion tokens. Circulating supply changes under the published release plan; check the source and reporting month beside that figure. The monthly supply record and the live price panel can update on different schedules; avoid combining them as if they were sampled at exactly the same instant. SUI tokenomics explains allocation and staking mechanics, and the release schedule covers upcoming circulation changes.

Why Does the SUI Price Move?

Market prices reflect transactions across venues rather than a single official network price. News, broader crypto-market moves, changes in liquidity and concentrated buying or selling can all matter. A chart cannot identify which factor caused a specific move without evidence from the same period. If SUI is down today, compare the timestamped SUI change with BTC and the broader market, review volume and look for a specific verified event before offering a causal explanation.

For a decision involving a wallet payout, use the actual order conditions. Market price, a pair converter and the amount an exchange can deliver after costs answer different questions. The SUI exchange routes show available directions; the market figures here remain informational.

Trader analysing price charts on multiple monitors

FAQ

Read the latest USD value and its update time in the live market panel. Multiply that value by your coin amount for a reference calculation; an executable exchange order may give a different net payout.

No. USDT is a separate token that targets one US dollar. The pair is useful for market context, but a USD-labelled price should come from USD-denominated data or a clearly explained conversion.

No. ATH records a historical observation from a data provider. It is not an order quote, a valuation target or a forecast.

They may use different venues, data aggregation methods, quote currencies or refresh times. Compare the timestamp and market definition before concluding that either figure is wrong.